What a time-current curve represents
A time-current curve is a graph showing the relationship between the current flowing through a protective device and the time the device takes to operate. Current is generally plotted on one axis and operating time on the other, often using logarithmic scales so both modest overloads and large fault currents can be considered. The curve describes device behavior; it is not a guarantee of a single exact operating time for every event.
Depending on the device and curve convention, plotted information may show a range of possible response times rather than one line. A circuit breaker’s trip unit, a fuse, or another protective device can have different response characteristics. The applicable manufacturer data and device configuration determine what a particular curve means. Engineers use curves alongside system information, not as a standalone selection tool.
Why curves matter in coordination
In a distribution system, protective devices are arranged at different points between the source and connected loads. Selective coordination aims for the protective device nearest a fault to operate first, where the system design and applicable requirements call for that behavior. Comparing device curves can help reveal whether an upstream device might also trip during a downstream fault, interrupting more of the installation than intended.
Curve comparison is only one part of the evaluation. Engineers also need the available fault-current information, device settings and characteristics, conductor and equipment limits, and the project’s required operating conditions. A drawing that appears to show separated curves does not by itself establish coordination across every relevant current or operating scenario. The responsible engineer must evaluate the complete system and confirm applicable requirements.
Reading curves without overinterpreting them
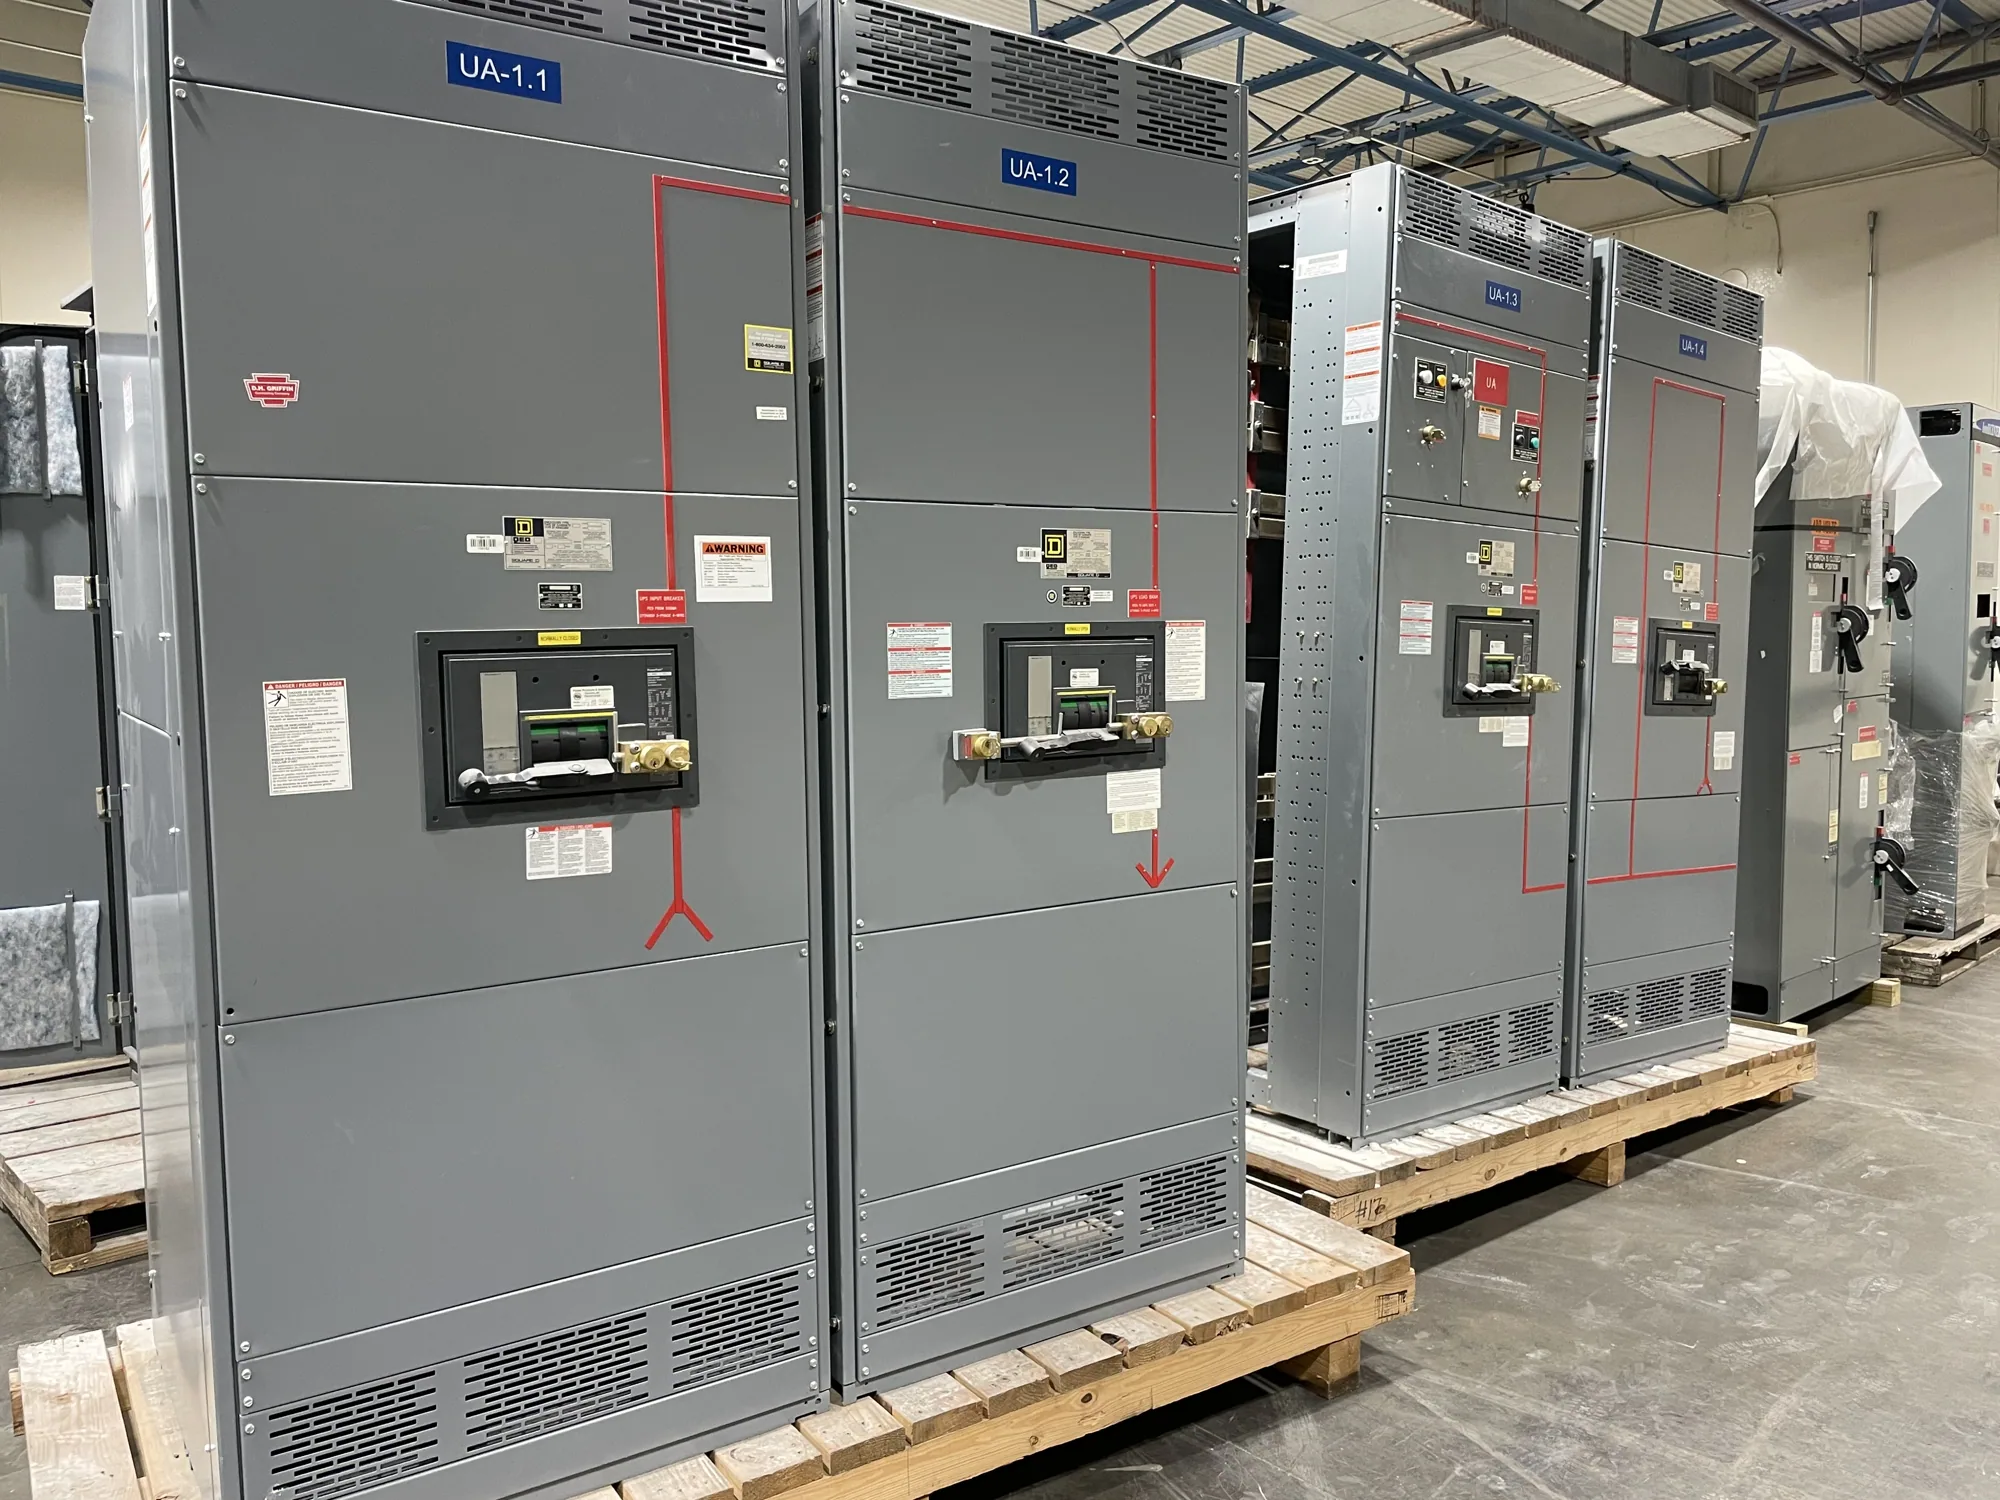
Consider a conceptual low-voltage switchgear arrangement with a main protective device and a feeder device serving a downstream panel. Assume a fault occurs on a feeder circuit. The design question is whether the feeder device can clear that fault before the main device responds, while still providing appropriate protection for the equipment and conductors. No device ratings or settings can be inferred from this example; they must come from the actual design.
On the curves, the engineer compares the feeder’s response band with the main device’s band over the current range that matters. If the bands overlap, or if they are too close to distinguish given device tolerances and other relevant conditions, selective operation may not be demonstrated. Conversely, visible separation on a particular plot does not prove performance in every case. The data, assumptions, and evaluation method should be checked against the project specification and responsible engineering judgment.
Common misunderstandings and related terms
A time-current curve is not the same as a single trip setting, a coordination study, or a complete equipment specification. A setting identifies a selected device adjustment; a study evaluates how devices interact within a defined electrical system. Curves help inform that work, but do not replace the system model, fault-current calculations, or review of device and assembly documentation.
Selective coordination describes a design objective or evaluated relationship among protective devices; a time-current curve is one tool used to examine it. Other considerations may include instantaneous response, short-time behavior, device tolerances, and the range of fault currents considered. Terms and available data can differ by device type and manufacturer, so ask the engineer to explain the plotted bands and assumptions rather than treating every curve as directly comparable.
Implications for new low-voltage switchgear
For a new low-voltage switchgear project, coordination requirements can affect protective-device selection, trip-unit features, settings, and the information needed before equipment is configured. Share the one-line diagram, system voltage, source details, available fault-current data, load and feeder information, and any project criteria for selective coordination. The engineer can identify missing inputs and determine which device curves and other documentation are needed.
South Carolina Switchgear Builders manufactures new equipment custom to specification, with US-built equipment and all-American components. The proposed configuration must be reviewed against the project’s actual electrical and documentation requirements; product availability and lead time depend on the order and must be confirmed. If a low-voltage switchboard is being considered, any applicability of UL 891 and assembly listing must be verified for that specific design. Switchboard and switchgear terms are not interchangeable, and a curve alone does not establish an assembly’s listing or ratings.
Questions to resolve before specifying equipment
- Which protective devices and operating modes must the evaluation cover, and what fault-current range is relevant?
- What manufacturer curves, device settings, tolerances, and supporting data are available for the proposed configuration?
- What project, code, or owner criteria govern selective coordination, and who is responsible for confirming compliance?
- Are the equipment voltage class, interrupting requirements, and other ratings established by the responsible engineer?
- What information and review milestones are needed before the equipment specification and delivery schedule can be confirmed?
Provide these answers early to help align the equipment design with the system study and project documents. Qualified personnel should perform installation, testing, and maintenance under applicable safety procedures. A clear curve review, paired with complete system information and explicit project criteria, gives the engineer and equipment supplier a sound basis for resolving design questions before the new distribution equipment is finalized.